
Core Concepts#
We’ll start with some definitional work.
Descriptive Statistics#
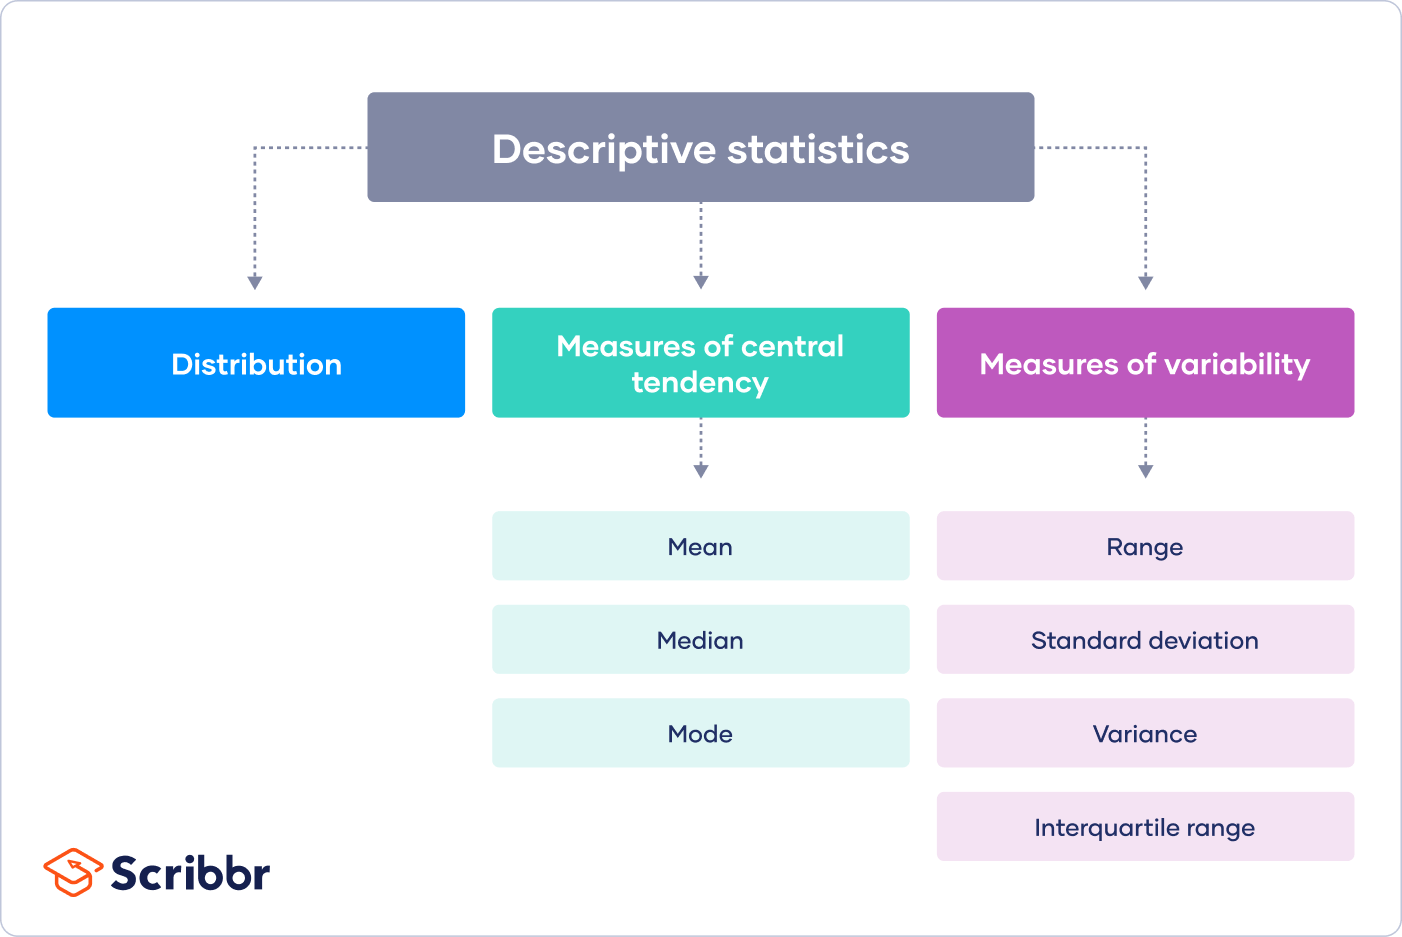
A summary (or descriptive) statistic summarizes and describes observations. It can include things like…
Determining centrality using
medianormeanDetermining dispersion using
rangeordeviation
Data Types#
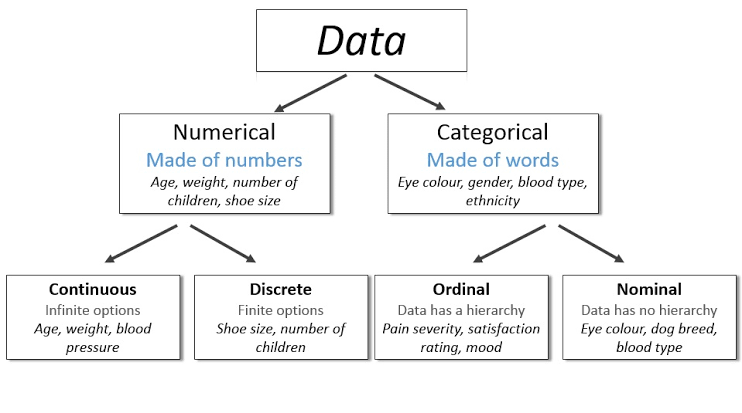
Numerical data consists of numbers and can be discrete (made up of finite options) or continuous (infinite options).
Categorical data consists of words, terms, or strings. It can be ordinal (on a scale or part of a hierarchy) or nominal (no scale or hierarchy).
We’ve already seen examples of these different data types, but now we have some language that helps us connect our prior work with different data types to analysis workflows.
Distinctions across data types become especially relevant when making visualiation choices.
Analysis Workflows#
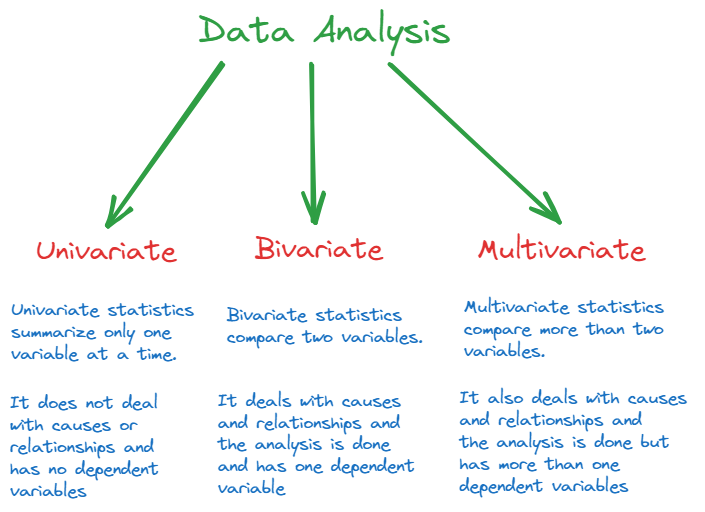
When we start making choices about aggregating our data, one of the first steps is deciding what aspects of our data (or variables) we want to work with.
Univariate involves a single column, characteristic, or attribute.
Bivariate involves two variables or columns.
This type of analysis can help show relationships, things like causation, correlation, change over time, etc…
In this workflow, there is typically a dependent and independent variable.
Multivariate involves more than two variables or columns.
This type of analysis can also help show relationships, causation, correlation, etc.
This workflow typically includes more than one dependent variable.