
Box Plots#
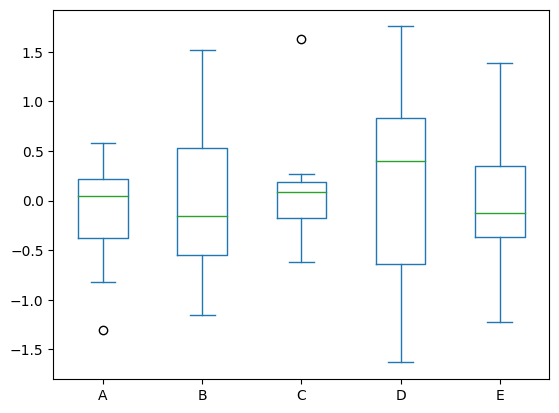
We can generate box plots using .plot.box() or .boxplot(). The default settings visualize the distribution of values within each column.
Back to our random number DataFrame, this time with five columns.
import pandas as pd, numpy as np # import statements
df = pd.DataFrame(np.random.randn(10, 5), columns=['A', 'B', 'C', 'D', 'E']) # create random data
df.plot.box() # box plot
<Axes: >
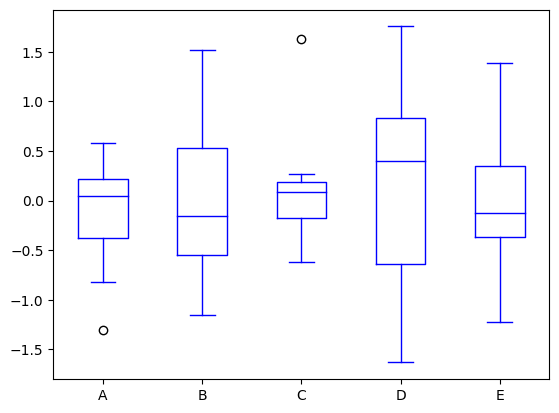
We can add colors to our box plot using the color keyword.
df.plot.box(color='blue') # set color
<Axes: >
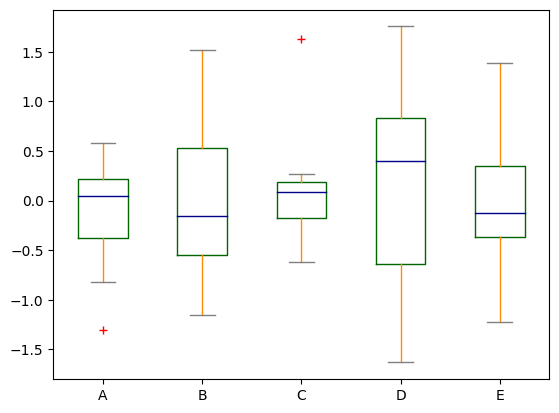
We can also use a dictionary with key-value pairs for each component of our box plot.
color = {"boxes": "DarkGreen", "whiskers": "DarkOrange", "medians": "DarkBlue", "caps": "Gray",} # color dictionary
df.plot.box(color=color, sym="r+") # draw plot and specify colors and outlier symbol using keyword argument or kwarg
<Axes: >
Additional Resources#
For more on box plots: