
Histograms#
The .plot.hist() method will generate a histogram. We can also use .hist() to generate a histogram.
import pandas as pd, numpy as np # import statmeents
# generate random data
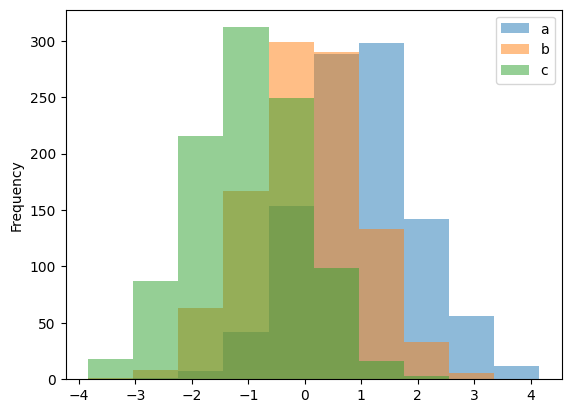
df = pd.DataFrame({"a": np.random.randn(1000) + 1, "b": np.random.randn(1000), "c": np.random.randn(1000) - 1,}, columns=["a", "b", "c"],)
df # inspect data
| a | b | c | |
|---|---|---|---|
| 0 | 1.810398 | 0.207306 | -1.719783 |
| 1 | 0.229618 | 1.878545 | -0.869958 |
| 2 | -0.393201 | -0.054595 | -0.952195 |
| 3 | 1.470702 | 0.612677 | -0.366439 |
| 4 | 2.174134 | 0.468061 | -1.417535 |
| ... | ... | ... | ... |
| 995 | 1.944827 | 1.185007 | -2.180961 |
| 996 | 0.763507 | -0.420616 | -1.165496 |
| 997 | 1.142902 | 0.248652 | -1.112617 |
| 998 | -0.246135 | -0.601180 | -0.623862 |
| 999 | 1.005845 | -0.106212 | -0.264363 |
1000 rows × 3 columns
df.plot.hist(alpha=0.5) # create plot
<Axes: ylabel='Frequency'>
Other Parameters#
We can set stacked to True to create a stacked histogram.
df.hist(stacked=True) # stacked histogram
We can also specify the bin size using the bins keyword.
df.plot.hist(bins=20) # modified bin number/size
Additional Resources#
We can use the .hist() method in matplotlib to further customize our histogram: matplotlib.axes.Axes.hist
For more on histograms: