
A Brief Introduction to Geospatial Data#
A deep dive into geospatial data, geographic information systems (GIS), and geospatial statistics is outside the scope of this course.
But we’ll start with a working definition:
"Geospatial data is information that describes objects, events or other features with a location on or near the surface of the earth. Geospatial data typically combines location information (usually coordinates on the earth) and attribute information (the characteristics of the object, event or phenomena concerned)" (IBM, "What is geospatial data?")
Types of Geographic Units#
Geospatial data can exist at a number of different scales.
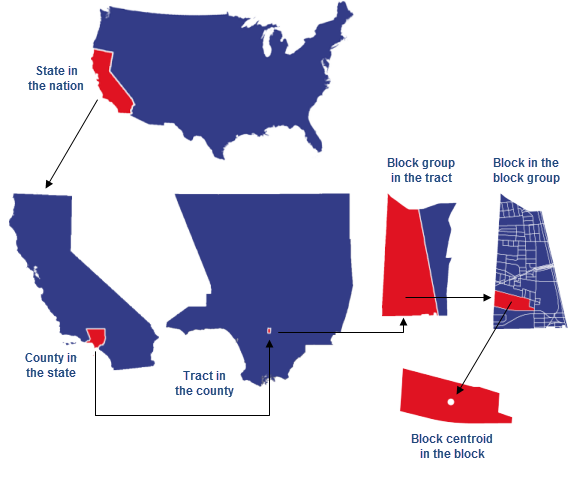
For example, some of the available geographies for the U.S. Census Bureau include:
State
County
Tract
Block
We could think about other geographic units that might show up in civic data:
City
School district
Service area
Data Structures#
As mentioned in the working definition, most geospatial data includes some kind of location information along with some kind of attribute information.
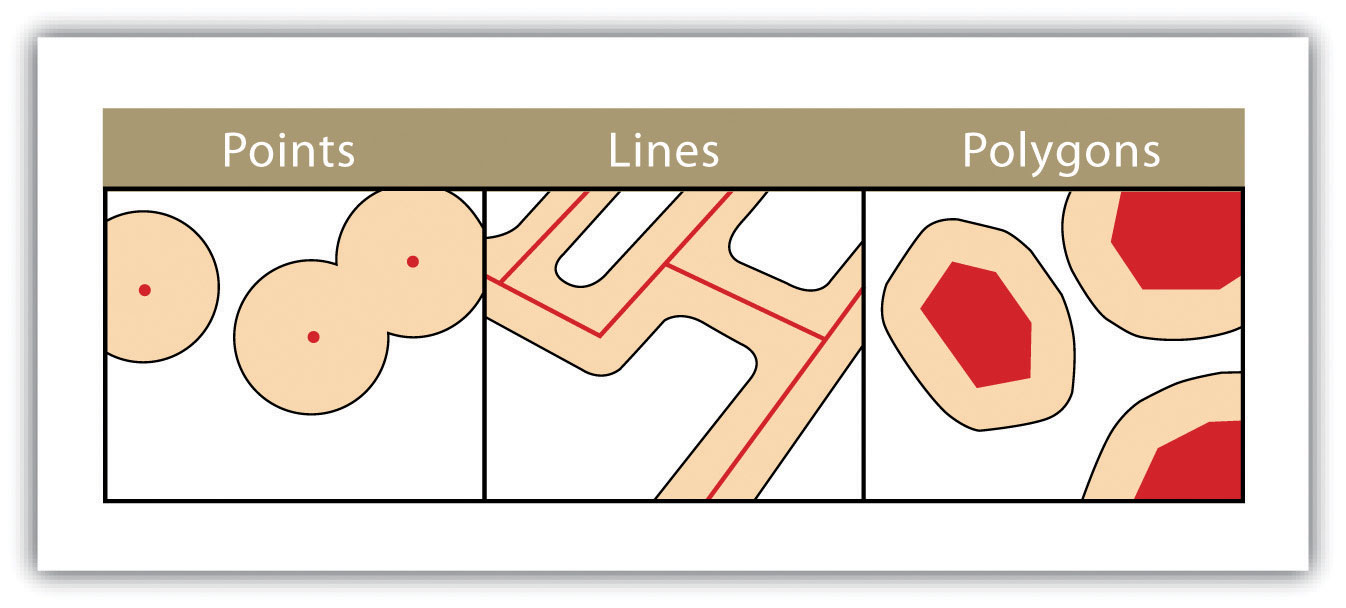
For our purposes, we’ll be focusing on point and polygon data types.
Point#

For locations that exist at a specific point, latitude and longitude are most commonly used.
These values are formatted as a positive or negative number with some number of decimal points.
For example, the latitude and longitude for our DeBartolo classroom:
Latitude:
41.69792875369083Longitude:
-86.23599211575898Combined:
41.69792875369083, -86.23599211575898
Polygon#
But we can imagine scenarios where a single point isn’t the best way to represent place.
For example, to aggregate data for a city, county, or state, we’ll need to connect attribute data with a shape or outline for the geographic area.
We can do this using polygons, which use a series of latitude and longitude points to draw a shape area or outline.

For example, the St. Joseph County’s GIS hub includes data with boundary lines for the county’s townships.
An excerpt of the JSON data for the Portage township, which includes sections of Notre Dame’s campus.
{ "type": "Feature", "properties": { "FID": 6, "AREA": 969156812.38699996, "PERIMETER": 969156812.41400003, "NAME": "PORTAGE TWP", "Shape__Area": 161489679.12890601, "Shape__Length": 65237.738699731897 }, "geometry": { "type": "Polygon", "coordinates": [ [ [ -86.267226587970598, 41.723066899159001 ], [ -86.267225408671806, 41.723038150440502 ], [ -86.267225181045106, 41.723032602169503 ], [ -86.267220820435497, 41.722926967632702 ], [ -86.267203887324797, 41.722516090142697 ], [ -86.267193307456196, 41.7222588628943 ], [ -86.267187470086199, 41.722117559473503 ], [ -86.2672563272113, 41.721644485753501 ], [ -86.267299529002599, 41.720844282568301 ], [ -86.267266978412493, 41.719991646494698 ], [ -86.267264008630804, 41.719838664570503 ], [ -86.267269018750497, 41.719669860991502 ], [ -86.267284844776896, 41.7194824764548 ], [ -86.267307800025307, 41.7193170094557 ], [ -86.267392086923195, 41.718706637366502 ], [ -86.267435674933495, 41.718224776196898 ], [ -86.267445553538394, 41.718154743627998 ], [ -86.267458579994297, 41.718090869408002 ], [ -86.267468739631497, 41.718051023258901 ], [ -86.267482390024398, 41.718004983989601 ], [ -86.267503123585996, 41.717945186005103 ], [ -86.267596364994901, 41.717706626153998 ]] ] } },
Putting It All Together#
To recap, geospatial data can include points or polygons, with attribute data connecting to geospatial data.