
.groupby() & .value_counts()#
.groupby()#
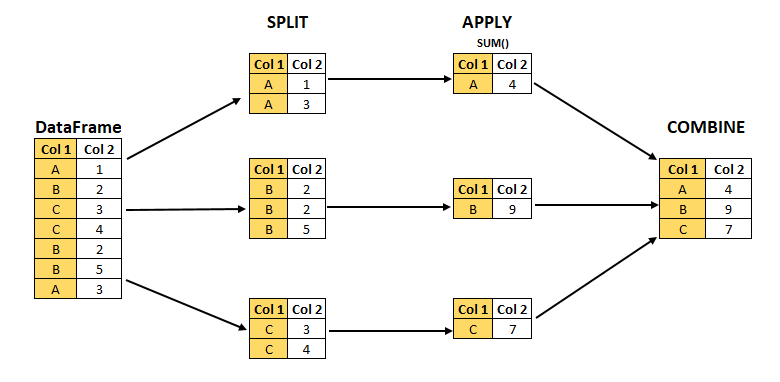
Generally speaking, this type of pandas operation follows a split-apply-combine pattern. pandas syntax combines the apply and combine steps.
First we
splitthe data into groups.Then we
applya function to each group independently.Then we
combinethe function results into a data structure.
In this example, we’ll work with the Census Bureau API return.
Specific dataset we’re working with: American Community Survey 1-Year Estimates Public Use Microdata Sample
# creating dataframe from API return
import pandas as pd, requests, json # import statements
page = requests
r = requests.get("https://api.census.gov/data/2022/acs/acs1/pums?get=SEX,AGEP,MAR&SCHL=24")
data = r.json() # store response
df = pd.DataFrame(data[1:], columns=data[0]) # create the dataframe, making the first sublist the column headers, and starting with the first row of data to avoid duplicating headers)
df = df.astype(int) # change datatype for all columns
df.info() # show updated technical summary
df # show output
For example, let’s say we wanted to calculate average age by marital status.
df[['MAR', 'AGEP']].groupby('MAR').mean() # average age by marital status
The first set of brackets ([]) isolates a subselection with only these two columns. Then we apply the .groupby() method to the MAR column to calculate .mean() for the AGEP values.
Another way to calculate average age by marital status, using a slightly different syntax:
df.groupby('MAR')['AGEP'].mean() # average age by marital status
In this alternate example, the column name in the .groupby() parenthesis specifies the column to group by. The column name in brackets ([]) specifies the column to perform the mathematical function on.
Additional Resources#
`.value_counts()#
We can also count the number of records by category using .value_counts(). The .value_counts() method returns the number of records for each category in a column.
Let’s say we want to know the number of records for each marital status. Thinking through the underlying logic, we need a program that groups by marital status and calculates the number of records for each unique value.
df['MAR'].value_counts() # count number of records for each marital status unique value
We could also break out these steps using a combination of .groupby() and .count().
df.groupby('MAR')['MAR'].count() # count number of records for
In the second example, we are explicitly categorizing the data by category in the MAR column, then performing a .count() operation on the records for each MAR category.
Putting It All Together#
A few key takeaways:
We can calculate aggregate statistics for entire rows or columns
.groupby()follows asplit-apply-combinepattern.value_counts()can be a shorthand for getting the number of entries for each category in a field