
Ploting in Pandas#
Having to load data manually to build a visualization or plot gets cumbersome quickly. In many situations, we might want to work with data in a pandas DataFrame when building a visualization.
The pandas .plot() attribute relies on the matplotlib API to generate plots, so our work with matplotlib will come in handy when we need to customize plots generated using .plot(). And in many cases, the .plot() syntax is similar to matplotlib OO syntax.
We’ll start by working with air quality data.
.plot()#
We can do a quick visual check of the data by passing the entire DataFrame to .plot().
import pandas as pd # import statements
df = pd.read_csv('https://raw.githubusercontent.com/kwaldenphd/elements-of-computing/main/book/data/ch10/air_quality_no2.csv', index_col=0, parse_dates=True) # load data
df # show output
| station_antwerp | station_paris | station_london | |
|---|---|---|---|
| datetime | |||
| 2019-05-07 02:00:00 | NaN | NaN | 23.0 |
| 2019-05-07 03:00:00 | 50.5 | 25.0 | 19.0 |
| 2019-05-07 04:00:00 | 45.0 | 27.7 | 19.0 |
| 2019-05-07 05:00:00 | NaN | 50.4 | 16.0 |
| 2019-05-07 06:00:00 | NaN | 61.9 | NaN |
| ... | ... | ... | ... |
| 2019-06-20 22:00:00 | NaN | 21.4 | NaN |
| 2019-06-20 23:00:00 | NaN | 24.9 | NaN |
| 2019-06-21 00:00:00 | NaN | 26.5 | NaN |
| 2019-06-21 01:00:00 | NaN | 21.8 | NaN |
| 2019-06-21 02:00:00 | NaN | 20.0 | NaN |
1035 rows × 3 columns
df.plot() # plot entire dataframe
<Axes: xlabel='datetime'>
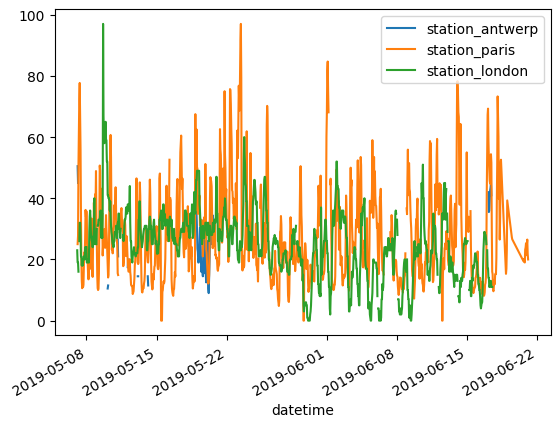
This isn’t a particularly meaningful visualization, but it shows us how the default for .plot() creates a line for each column with numeric data.
Default settings for Pandas plotting functions:
index(in this caseDateTime) is thexaxis dataNumeric columns are the
yaxis dataDefault plot type is a line plot
Default axis title(s) and legend are pulled from information in the underlying
DataFrame
Plotting Specific Columns#
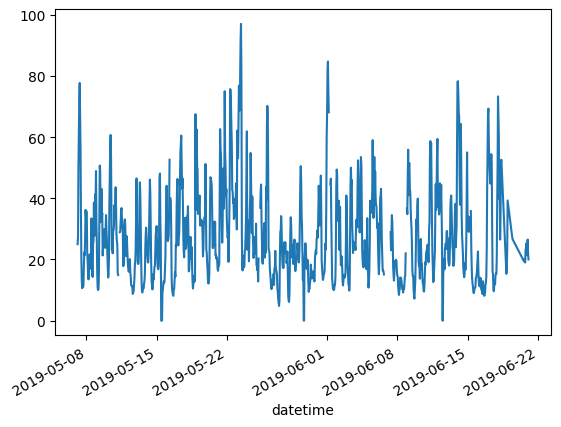
Let’s say we only wanted to plot Paris data. We can plot a specific column in the dataframe using the [" "] selection method before calling .plot().
df["station_paris"].plot() # plot specific column
<Axes: xlabel='datetime'>
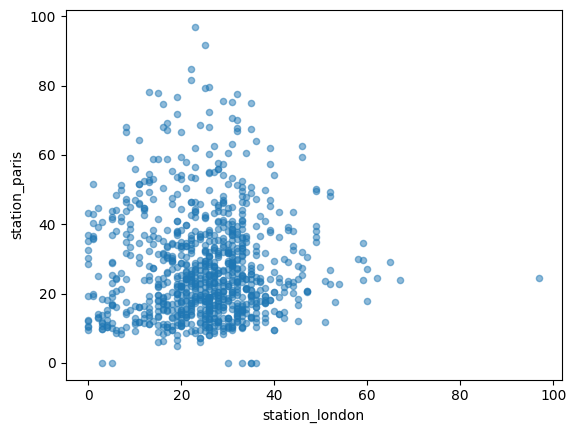
Let’s say we want to visually compare NO2 values measured in London and Paris. We need to specify what column is going to be used for the X axis as well as what column is going to be used for the Y axis.
For this example, a scatterplot will be more effective than a lineplot, so we’ll use .plot.scatter().
df.plot.scatter(x="station_london", y="station_paris", alpha=0.5) # scatterplot for two columns
<Axes: xlabel='station_london', ylabel='station_paris'>
Additional Line Plot Resources#
For more on line plots:
Additional Scatter Plot Resources#
For more on scatter plots:
Recap#
As we’ve already seen Pandas plotting functions incorporate a mix of Pandas syntax and arguments that share similarity with matplotlib.
We’ll see that pattern continue as we explore other plot types and plotting workflows.